01 · Before the tradeYou are here

ChartViews AI
Reads the chart
- Upload a chart screenshot from any platform.
AI chart analysis · Educational
Upload a chart screenshot. Get the trend, key levels, two scenarios and the point where each one is wrong.
 Sample report
XAU/USD · 4H
Gold vs US dollar
Any platform, market or timeframe.
Trend, levels and two scenarios.
See where each idea would be wrong.
Real screens. Swipe sideways.Real screens, in the order you meet them.
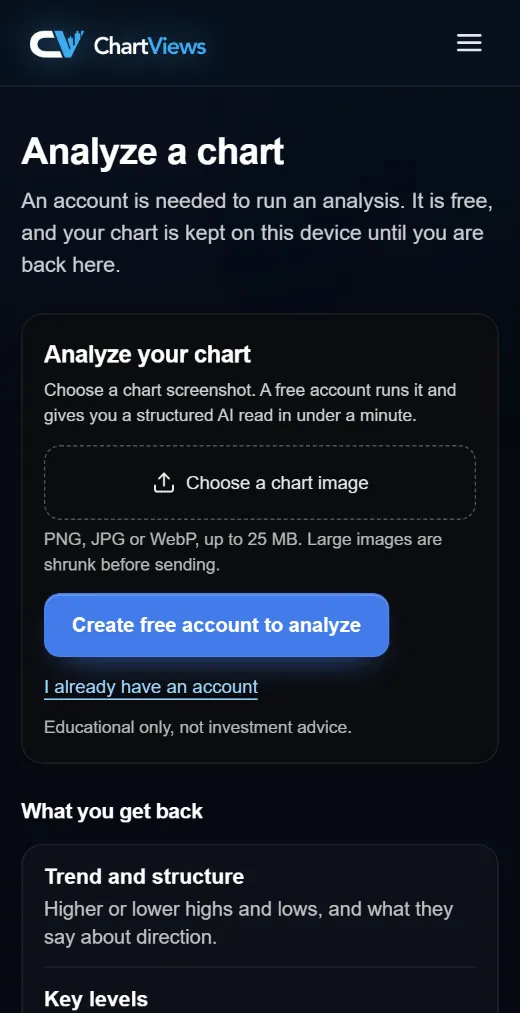
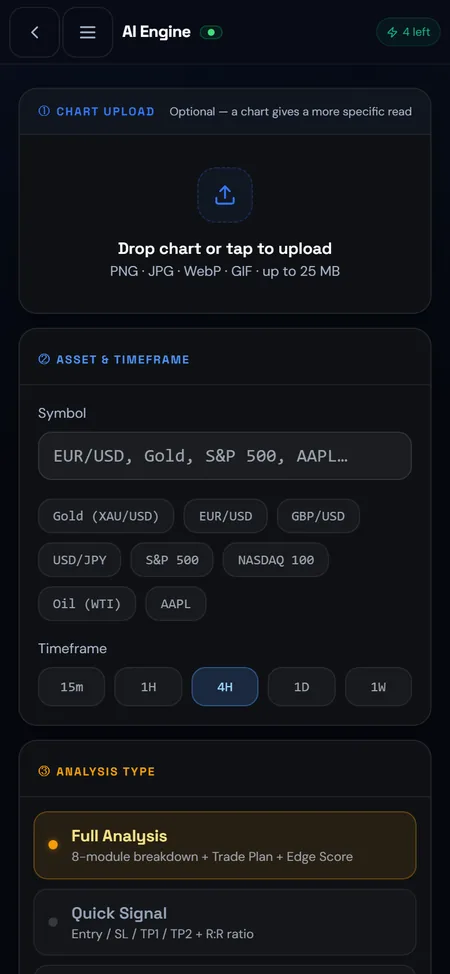
1 · Upload a chart
Every level comes with the line where the idea is wrong. AI can misread a chart, so check each one yourself.
Educational analysis, not financial advice.
Start free
Up to 3 analyses a day. No card required. Plans from $9.99/month.
The app
Screenshot a chart, upload it, read the plan. Your history syncs.
AI can misread a chart. Check each level before you act on it.
The five passes, step by stepReport vs. chat replyHow the free trial works
Read the chart, learn and log the trade, then find the habit behind the result. Three tools that work together: ChartViews AI on its own or with Money Circle, Trader Reflect with a paid Money Circle membership.
Reads the chart

Learn, trade, log

Finds the habit
or $699.90/year · 2 months free
$62.99 first month, then $69.99/mo
Unlimited is capped at 100 analyses per day (fair use). The day resets at 00:00 UTC.
Card: renews monthly or yearly until you cancel. PayPal or crypto: one-time payment for 30 days (monthly) or 365 days (yearly), no auto-renewal.
 Double Tops and Bull Flags on Gold: Confirmation, Invalidation, RatioNovember 13, 2026 · 6 min read
 How to Draw Trend Lines That Hold, Step by StepNovember 10, 2026 · 7 min read
 Multi-Timeframe Analysis for Indices: US100, US500, GER40November 4, 2026 · 6 min read
 How to Check an AI Chart Analysis Before You Trade ItNovember 4, 2026 · 6 min read
New accounts get a 7-day free trial with up to 3 completed analyses per UTC day, no credit card required. Failed analyses are not counted and the allowance resets at 00:00 UTC. After that, subscribe from $9.99/month, or save with yearly billing. New customers get 10% off their first month.
Forex, indices, metals, stocks and futures: anything with a chart you can screenshot, on all major timeframes from 1m up to 1W.
Upload any chart screenshot and the AI reads market structure, trend, volatility, liquidity zones and confluence levels. Everything is mapped into the same structured 8-module report, including two scenarios, an invalidation level and a risk-reward plan. AI can misread a chart, so check every level yourself.
Plans: Lite is $9.99/month for 2 analyses per day; Standard is $29.99/month for 5 analyses per day; Plus is $69.99/month for 15 analyses per day; Unlimited is $249.99/month for up to 100 analyses per day (fair use). Yearly billing is also available at 10 times the monthly price (2 months free): $99.90/year, $299.90/year, $699.90/year and $2,499.90/year.
Yes. Card: renews monthly or yearly until you cancel. PayPal or crypto: one-time payment for 30 days (monthly) or 365 days (yearly), no auto-renewal. You keep access until the end of the period you paid for.
No. ChartViews is an educational tool. Reports help you understand chart structure and market context; they are not trade signals or financial advice. You are always responsible for your own decisions.
Also on mobile: live on the App Store and Google Play, free to download.